The DC Comprehensive Plan (“Comp Plan” or “Plan”) is a key legislative document that covers a range of topics, from economic development, housing, the environment, parks and community services, transportation, and more.
There are maps within the Comp Plan, the most important being the Future Land Use Map (FLUM).
The Future Land Use Map (FLUM) determines how DC will develop and grow as we move into the future and allows all residents and city planners to anticipate and prepare for development, no surprises!
The DC Office of Planning under the direction of the DC Mayor is now suggesting changes to the Comprehensive Plan, 1500-redlined pages of proposed amendments to the existing Plan policies and maps. They have delivered these proposed changes to the DC City Council to consider passing into law.
The Mayor put up a website to show the public (to a degree) the massive tome of amendments to the Plan. By the way, if you don’t speak or read English, you have been left completely out of the conversation.
On the Mayor’s Comp Plan website, there is a nifty maps page that was recently uploaded that uses a slider to let you see the proposed areas of the city where the Office of Planning wants to change future development, going up with bigger and denser buildings.
Sliding over the whole city and you see an array of properties that the Mayor seeks to upzone, aka upFLUM. What you don’t see are the numbers in square feet of how much density the mayor wants to allow to be developable as a “matter of right” (MOR).
In fact, no where on the Mayor’s Comprehensive Plan website will you find any facts relaying to the public that the proposed FLUM map changes equate to upzoning close to 200 million square feet of land and air rights.
As a friend suggests, the map changes show city officials essentially printing money for the landowners of these lucky properties being upFLUMed.
The result of this conversation was a matrix showing the reality of the proposed changes to the Comprehensive Plan FLUM map, or almost 200 million square feet of proposed upzoning around the city.
This 200 million square feet of new habitable space and construction represents about what would be 100 “matter of right” McMillan Park projects.
Why should we expect the Mayor’s Office of Planning actually do any “planning”? In fact the DC Council Chairman thinks planning is a popularity contest!
Read how the Office of Planning’s proposed changes to the Comp Plan is going to exacerbate displacement of Black folks in DC, click here.
Nostalgic Gentrification As A Development Tool Vs. A More Practical And Budget Friendly Use of Circulator Buses
Transit Opinion by: Iris McCrea, Ward 7 Resident and Fort Dupont Civic Association Member
. . .
The position of the Fort Dupont Civic Association is against the extension of the Streetcar beyond the Langston Golf Course at Oklahoma Avenue, NE to East Capitol Street and Benning Road NE. However, we do support transit-oriented development along Benning Road and through sub-neighborhoods from Oklahoma Avenue to Southern Avenue which is even beyond the proposed end of the streetcar route.
. . .
[T]he Fort Dupont Civic Association strongly recommends the use of the Circulator Buses starting at Oklahoma Avenue instead of streetcars.
Ward 2 Councilmember Brooke Pinto Supports Defunding The Giveaway of McMillan Park, Further Exposing Greater Greater Washington as a PR Team for Mega-Real Estate Speculators
Ward 2 Councilmember Brooke Pinto has been added to the growing list of DC officials and candidates calling for the controversial McMillan Project to be defunded and/or competitively re-bid, seeking substantial changes to the project like including much more public green space and much more truly affordable housing for families. For example, there isn’t one affordable housing unit for a family of four with an income less then $60,000 specifically set in the current project, among many other issues.
That Pinto suggested the McMillan project as a cost burden to DC demonstrates one of two things: either she is opposed to new housing and offices in DC on sites that have gone through years of public review (probably unlikely), or she is so unaware of long-running District issues, having never voted in DC before running for office, that she is basing her position on a fringe element that supported her in the primary rather than a detailed understanding of the issue.
GGW desperately supports the city’s current plan to pay private developers $75M to take the 25-acre site from the public and construct 2+ million square feet of medical office space, parking garages, retail, housing, and recreation space.
Sometimes stats are publicized in a way that can diminish real impacts of market rate growth and displacement of Black folks from DC.
But, US Census numbers don’t lie, and may likely be conservative. Between 2000-2010, about forty thousand Black residents left DC.
In 2011, soon after the 2000-2010 Census numbers were in and reported by the Federal government, local and national policy analysts began their crunching and talking about the results.
The census numbers affirmed what we were seeing with our eyes, the disturbingly high Black displacement being fueled by DC planning policies is real and it started under then new Mayor, Anthony Williams who put out the call to entice wealthier younger people to the city starting after his election in 1999.
But suddenly in recent years, these numbers about Black displacement have been halved in the corporate media (40k –> 20k). But why?
2019: THE STORY AND NUMBERS ABOUT DISPLACEMENT CHANGE
In the past year, the shocking numbers of displacement of Black folks from their DC homes had suddenly shifted downward using what seems a devious sleight of data manipulation and language that hasn’t been openly discussed. This has confused alot of people involved in the work of fighting displacement.
That is, the fact that 40,000 Blacks have been displaced from DC between 2000-2010 is now being shrunk back to a figure closer to 20,000 over a longer period of time between 2000-2013.
The following are articles that presented the new displacement figures:
‘It’s primarily racial’: Study finds DC has the most intense gentrification in the country. New York City had the most gentrification in terms of sheer volume, but D.C. was the most gentrified by percentage of eligible neighborhoods that experience gentrification. Between 2000 and 2013, 20,000 black D.C. residents were displaced, the study found. Hallie Mellendorf, April 18, 2019. WTOP news.
D.C. Has Had the Most Gentrifying Neighborhoods In The Country, Study Finds. D.C. had the highest percentage of gentrifying neighborhoods in the country between 2000 and 2013, according to a study from the National Community Reinvestment Coalition, a group that works to “increase the flow of private capital into traditionally underserved communities.” It estimates that around 20,000 black residents were displaced over that period. Mar 19, 2019. Cordilia James. DCist.
Who Can Afford to be a Washingtonian? Gentrification isn’t just about the proliferation of pricey salad shops and craft breweries. According to a 2019 study, gentrification in D.C. has pushed more low-income residents out of their homes than almost anywhere else in the country. Between 2003 and 2013, 20,000 black residents were displaced from D.C. By Caroline Hamilton. February 28, 2020. Georgetown Voice.
So if the census between 2000-2010 says 40,000 Black folks were displaced by DC’s development policies, then why do recent headlines suggest only 20,000 Black residents being pushed out?
The National Community Reinvestment Coalition’s Executive Summary of “Shifting Neighborhoods, Gentrification and cultural displacement in American cities” dated March 19, 2019, shows a nuance in language that has the effect of diminishing the scope of displacement, actually halving the numbers despite the study evaluation happening over a longer time period.
The term of art at fault here are the words “eligible neighborhoods” that show an “intensity” of gentrification as explained in the NCRC study but not divulged by the press outlets.
Digging down a bit, we see in the study’s Executive Summary how the scope of the study was limited to “eligible neighborhoods” where, “neighborhoods were considered to be eligible to gentrify if in 2000 they were in the lower 40 percent of home values and family incomes in that metropolitan area.”
And, the study goes on with a DC focus, “Washington, D.C., had the highest percentage of gentrifying neighborhoods. Nearly half the neighborhoods in the city were eligible for gentrification in 2000, and 41 percent of those neighborhoods gentrified by 2013, displacing more than 20,000 people. The continuation of a robust real estate market since 2013 means it is likely that this trend is continuing to this day.”
So in effect, the NCRC “intensity of gentrification” study is saying that between 2000-2013, the displacement of Black folks happened the most in existing Black DC neighborhoods, with 20,000 people being pushed out of their longtime homes and away from families and friends.
However, this nuanced statistic in no way can nullify the reality that according to the Census, overall, 40,000 Blacks have been displaced citywide between 2000-2010 and not just displaced from “eligible neighborhoods.”
Primarily, its strange to say what neighborhood is more eligible than any other for gentrification. Seems a racist concept on its surface.
But it’s highly disconcerting that just a slight shift in language and scope of study (“eligible neighborhoods”) will result in substantially diminishing the actual reality of real impacts on real people by DC’s pro-development policies and the planning decisions made throughout the City.
40,000 Black People Have Been Displaced from DC Between 2000-2010
The following are articles that broke the shocking news that DC’s Chocolate City was disappearing.
The number of African Americans residing in the District plummeted by more than 11 percent during the past decade, with blacks on the verge of losing their majority status in the city for the first time in half a century.
According to census statistics released Thursday, barely 50 percent of the District’s population was African American in 2010 — a remarkable shift in a place once nicknamed “Chocolate City.”
The black population dropped by more than 39,000 over the decade, down to 301,000 of the city’s 601,700 residents. At the same time, the non-Hispanic white population skyrocketed by more than 50,000 to 209,000 residents, almost a third higher than a decade earlier.
The census statistics showed a steeper change for both blacks and whites than had been estimated. With the city ‘s black population dropping by about 1 percent a year, African Americans might already be below the 50 percent mark in the city.
In a city that prides itself on being a hub of black culture and politics, a majority of residents have been black since whites began moving to the suburbs en masse at the end of World War II. By 1970, seven out of 10 Washingtonians were black.
The loss of blacks comes at a time when the city is experiencing a rebound, reversing a 60-year-long slide in population and adding almost 20,000 new residents between 2000 and 2010.
The Post breaking the story about 40,000 Black folks were followed on by other press and policy forums.
In examining the criticism of this new gentrification-analysis (a project, not a study) by students at the University of California Merced, we see several key aspects of the “urbanist” take on development of major cities in the US:
Pushing a dogmatic belief that building more market-rate studio and one bedrooms will trickle down housing costs and this “filtering” effect is the key way to get past a decade-long housing crisis.
Fostering ambivalence in municipal planning that eschews substantial permanent impacts that more development has on existing neighbors and neighborhood services such as a need for increased schools, libraries, clinics, parks, transportation, utility infrastructure, etc.
Believing that a #BuildMore housing policy (even if its largely expensive studios and one bedrooms) doesn’t need to take account of the resultant displacement of communities of color. That is, smart growth means having an absolute ambivalence to witnessing Black and Brown neighbors getting displaced and replaced by whiter new neighbors in almost all major US cities.
Possessing a monolithic cultural approach to reshaping cities in that all people — newcomers and existing residents alike — are expected to squeeze into untested development paradigms. That is, the desire to live with more neighbors is paramount to all other planning considerations especially if these new neighbors are whiter and able to afford significantly higher housing costs in much smaller unit sizes, and can afford expensive food, coffee and beer, appreciate yoga, and have a small dog.
However, if you are going to slam a qualitative look at gentrification and ignore the quantitative studies and real results of the overarching #BuildMore planning policies that this student project is based on, then you are acting in service to displacement. See the studies below.
For example, how about the data sets used to support the $1Billion Washington, DC gentrification lawsuit on behalf of longtime Black DC residents and families. The fact that real world data like that demonstrated in this critical lawsuit isn’t being incorporated by “urbanists” in their policy analysis & advocacy is quite telling, perhaps even a dog whistle.
Choosing to cherry pick and attack the one limited Street View project and then not openly assail existing harmful public policy that is actually driving our neighbors out of our longterm homes only helps propel real estate speculation and the developers bottom-line. Is that what you really want to do?
KEY STUDIES SEEMINGLY IGNORED BY CITY PLANNERS & URBANISTS
This study shows a feast or famine situation with government investments in our communities, and “[H]ighlights how gentrification and cultural displacement have unfolded in American cities, while many low-income small towns and rural neighborhoods remain starved of investment.”
A Governing report says, “Neighborhoods gentrifying since 2000 recorded population increases and became whiter, with the share of non-Hispanic white residents increasing an average of 4.3 percentage points. Meanwhile, lower-income neighborhoods that failed to gentrify experienced slight population losses and saw the concentration of minorities increase. They have also experienced different economic fates: Average poverty rates climbed nearly 7 percent in already lower-income tracts that didn’t gentrify, while dropping slightly in gentrifying neighborhoods.”
Blavity & Buzzfeed: “A new study … shows an increasing rate of Black residents are being driven out of neighborhoods in the U.S. According to the data, Oakland, Washington D.C., Atlanta, New York City and Baltimore are among the cities that are especially impacted by gentrification.”
This 2000-2010 study says, “Washington, DC, residents don’t need census data to tell them what’s obvious in their neighborhoods: the city is changing dramatically. But numbers can give us context. They can show us how shifts in population are reshaping the city and can help us prepare for changes to come.”
The LegalAid society interprets recent a key displacement study, “Cultural displacement happens when there is “a rapid decline” in the number of minorities in an area as “white gentrifiers replace” minority residents. Both gentrification and cultural displacement have left a powerful imprint on DC over recent years.”
To the public investment issue, “So where do upwardly mobile creatives go as they begin to get priced out? They seek less expensive neighborhoods, where the cycle of displacement continues. “Now, people are looking at Anacostia like, ‘Oh, this is a place to come,’” Aristotle Theresa said. “And so, now the government starts injecting capital into the area, when they didn’t before.”
WaPo analysis, “Low-income residents are being pushed out of gentrifying neighborhoods at the highest rate in the country. The neighborhoods that have experienced the largest outflow of low-income residents, according to the study — places such as Logan Circle, Petworth and Columbia Heights — have an average walk score of 82.5 and an average transit score of 74.5.”
Non-profit Quarterly comments, “The displacement numbers seem low, but the authors used fairly narrow definitions of gentrification and displacement.”
WJLA: Local Small DC Business also getting crushed under gentrification. “When you invest in a place without investing in the people, what happens is you’re displacing people,” Jesse Van Tol, CEO of the National Community Reinvestment Coalition (NCRC).
Georgetown Voice: “Gentrification isn’t just about the proliferation of pricey salad shops and craft breweries. According to a 2019 study, gentrification in D.C. has pushed more low-income residents out of their homes than almost anywhere else in the country. Between 2003 and 2013, 20,000 black residents were displaced from D.C.”
How about this study (from 2015) that defines gentrification not on a street view but on “a [census] tract’s median household income and median home value.”
Despite saying Gentrification is “beneficial” GGW cites studies that say, “A neighborhood out-mobility rate increase of a few percent on average, across gentrifying neighborhoods in the whole country, can mask what’s happening at the hyper-local scale. In certain neighborhoods, out-movement through displacement, whether direct or indirect, has likely been much higher.”
“In the District of Columbia, low-income residents are being pushed out of neighborhoods at some of the highest rates in the country, according to the Institute on Metropolitan Opportunity, which sought to track demographic and economic changes in neighborhoods in the 50 largest U.S. cities from 2000 to 2016.” https://housingis.org/resource/gentrification-dc-means
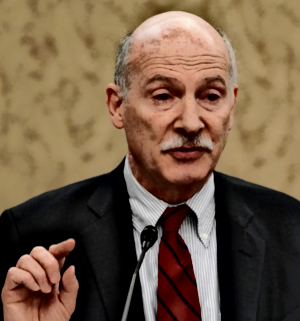
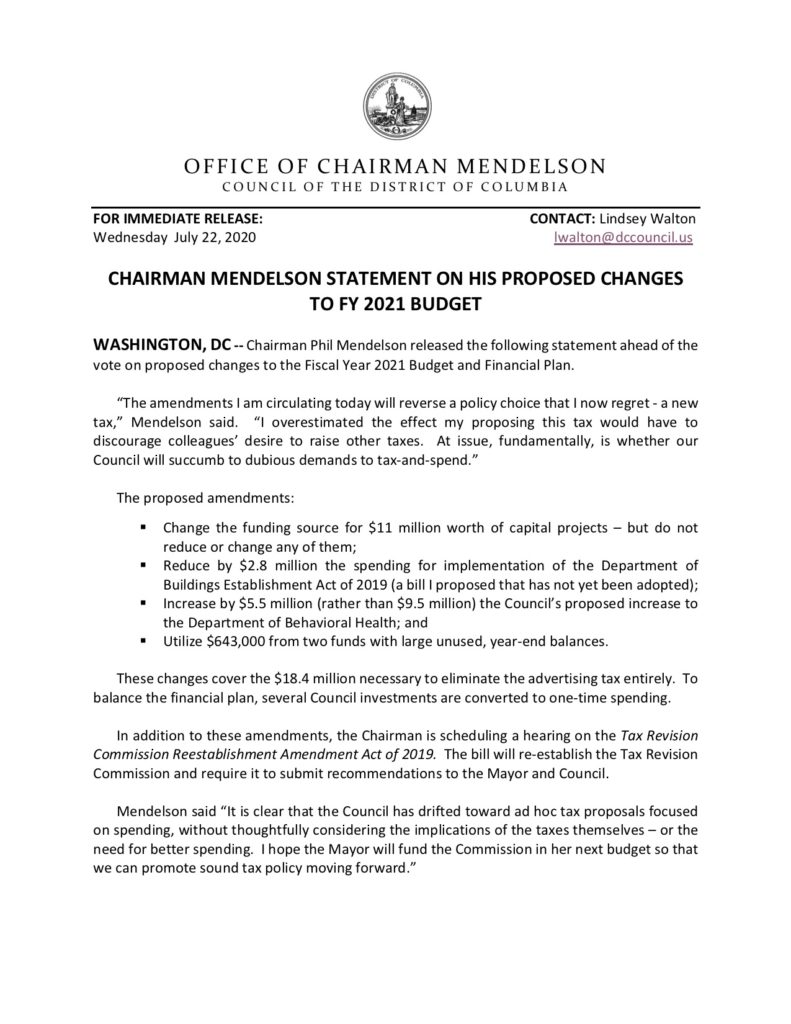
The fog of class war has the Council Chair saying things like it would be tantalizing to cut immigration services, emergency rent support, and other human services to make up for a stupid move to tax small publications in the District (The Ad Tax).
Playing both the perpetrator and now the self-proclaimed hero, CM Mendelson says he can eliminate the ad tax on small publications by moving some money around from the capital budget, cutting mental health services, and some other piddly wrangling. If this all seems a bit hexing, and wrong, it is.
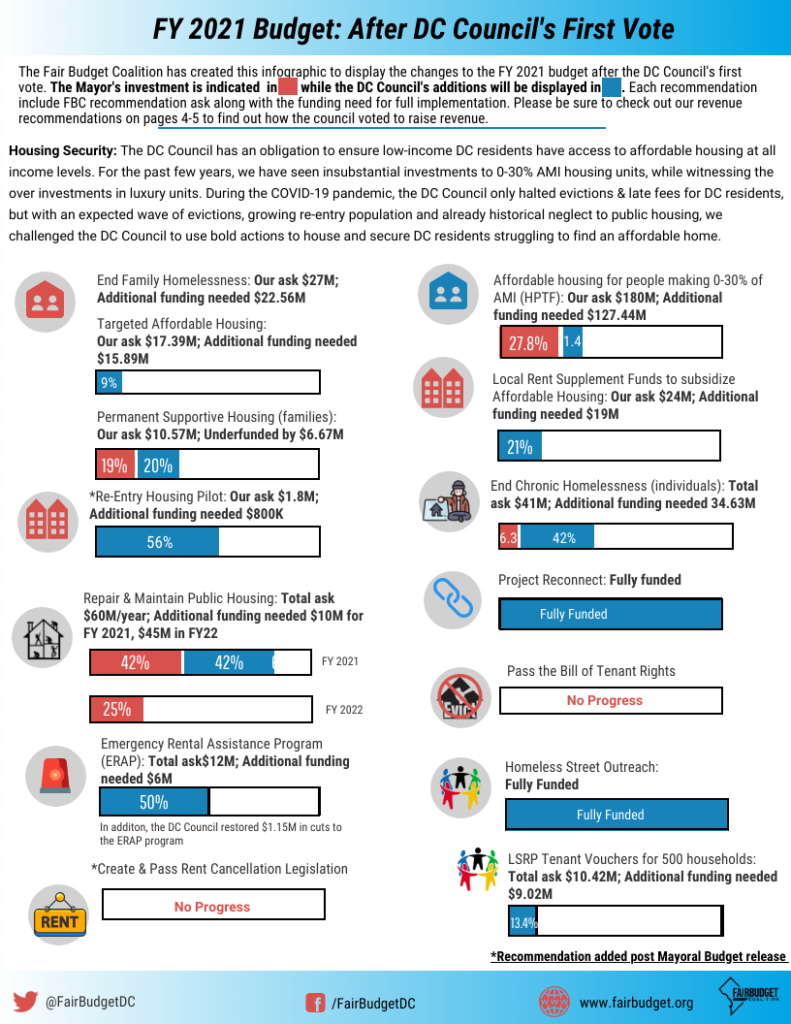
What a slick move, a smokescreen. First, this “debacle” has got the advocacy community to scramble their bases to beg the Council not to cut $18M more in services to real DC people instead of bringing on fire from the people demanding that the overall first budget vote be completely trashed and we start over. See FBC breakdown of the first Council vote on July 7th below:
The DC budget vote as shown above, even if the recent threats of 18M in cuts is reversed, is an absolute atrocity and in fact criminal to the working people of the District during a pandemic. There are no cuts to the Metropolitan Police Department budget for example!
Second, this confusing creepy clown show led by the Chairman during DC’s FY2021 budget process has allowed all Councilmembers, even the so-called progressives on the dais to deflect away from the broader call of the people to take the capitalists boot off working families necks by defunding MPD, raising taxes on the rich, and moving monies from proposed luxury projects to projects that could really help people now in the pandemic such as from the proposed McMillan Park giveaway to the long-stalled reopening of Crummell School for those families who are struggling in Ivy City.
Meanwhile, with all the content that the so-called urbanists pull off with the help of developer contributions, the budget vote is as important as one retweet of a DCist report. David Alpert is far from concerned about what this budget means for DC’s communities of color.
Conclusion: Its all perplexing but a skillful clumsy show put on by the Chair, Phil Mendelson and sheepish Council colleagues. The Chairman however is in the driver seat, commanding control over the city and outcomes for all its people in perpetrating an oppressive racist corporate agenda to crush Black families and communities of color and working residents of the District of Columbia.
To see this agenda and the people who pull the puppet strings, click the following links:
The DC Housing Crisis vs 30,000 Vacancies in DC. . . What is Going On?
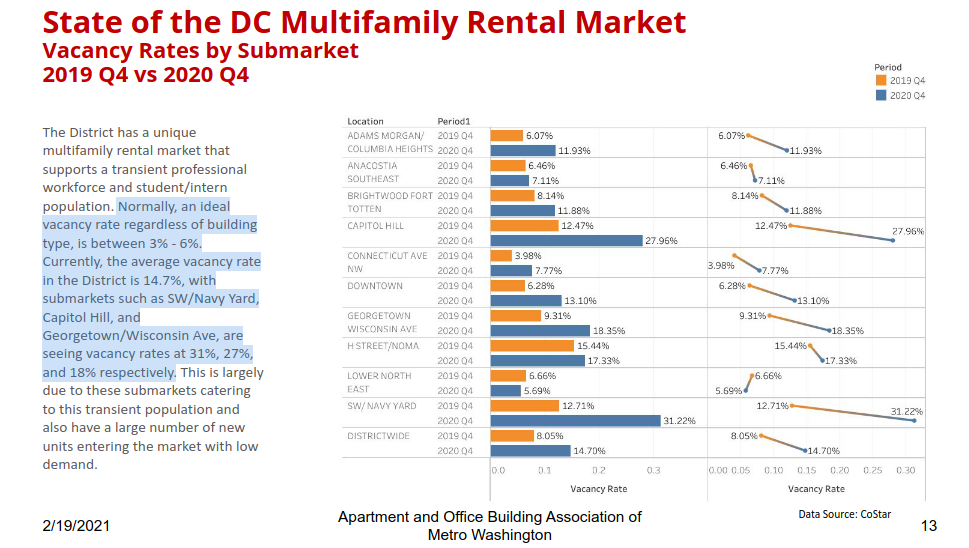
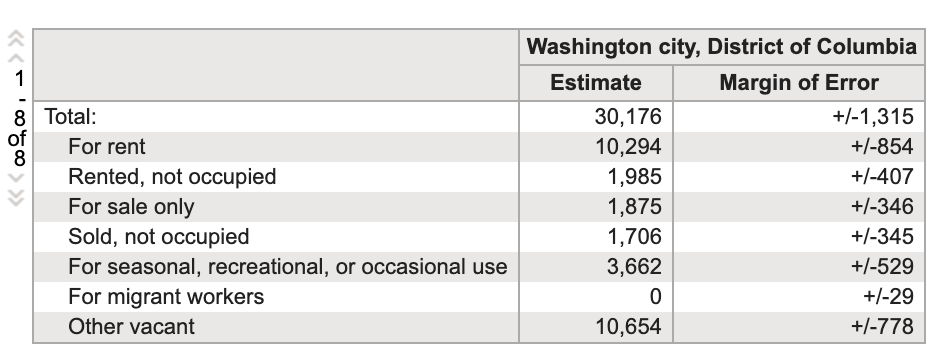
The vacancy information for Washington, D.C. below is based on the 2019 American Housing Survey (AHS) which is conducted biennially by the U.S. Census.
This AHS survey asks landlords about vacancy status, resulting in this table below (Table: B25004) representing a timeframe of 60 months of collected data. There are also 1-year and 3-year estimates.
The Metropolitan Statistical Area (MSA) is the smallest level at which the survey reports data.
How can there be 30,000 vacant units when we have a housing crisis?
Thirty thousand vacant units counted! This fact destroys any assumption that building more luxury housing will eventually result in lower cost housing units trickling down in what growth supporters call, “Filtering.”
Luxury Units Stay Empty Without Any Market Corrections
Luxury units for investment (lots of it foreign) results in developer demand for upzoning to increase buildable density without providing housing to be lived in. What is the good of new housing being kept uninhabited by investors? It stifles free market supply-and-demand and keeps prices of housing high, while allowing bankers and the construction industry to profit.
Empty housing units are also tax liabilities that can be written off by mega real estate speculators at the end of the year, equaling a form of income. Thus, the myth of the effect of supply-and-demand on housing is exposed as the tax write-offs for empty units completely nullifies any market corrections.
Foreign Investment in Luxury Housing Creates Exclusive New Communities in DC With High Vacancies
U.S. real estate remains attractive for illicit money from all over the world. In DC, that foreign money invests into planning officials follies, like the dramatic changes at Union Market in Northeast. #UnionMarketExclusive
It’s a stable investment that generally maintains or grows in value – and it gives corrupt oligarchs and dictators a potential escape route if they’re ousted from their home countries.
But this money drives out honest purchasers and makes cities hotbeds for dirty, unproductive cash. It turns cities and communities into commodities.
In one part of New York City, for example, the Census Bureau estimated that 30 percent of apartments are unoccupied most of the year.
Whomst really are we subsidizing, constructing, and housing in all these giant luxury boxes? Case in point: #SWWaterfrontExclusive
Legislation is needed to require habitation of units built. After all, owners are not permitted to keep houses vacant on the streets of DC. Why should it be different with condo or apartment buildings?
COVID UPDATE JUNE 2020
COVID UPDATE AUG 2020
The Washingtonian, August 3, 2020 — NoMa and H Street apartments are experiencing an 8.2 percent vacancy rate, while developments in Navy Yard and Southwest are seeing 7.7 percent vacancy. The vacancy rates in those areas were less than 5 percent at the same time last year. District-wide, the average vacancy rate in luxury apartments is currently 6.8 percent, compared to 4.1 percent last year.
Remember when Muriel Bowser, Mayor of the District of Columbia said Mumbo Sauce — DC’s famed condiment choice for chicken wings, fries, and pretty much anything yummy — annoyed her.
However, the resultant socioeconomic policies promulgated by Bowser and city officials in service to wealthy white men is actively harming local Black residents and longtime DC families living in established working-class neighborhoods of color.
D.C. has the highest ‘intensity’ of gentrification of any U.S. city recent studies show. Wapo story || DCist story.
King describes how the city plays an “active role in development [by] selling or leasing publicly owned land, changing zoning laws, closing alleys and providing developers with inducements to construct new — or refurbish old — buildings [putting] upward pressure on rents and housing values [forcing] poor folks…out of their neighborhoods… .”
DC PEOPLE ARE THE SAUCE. DISPLACEMENT IS A CRIME AGAINST PEOPLE AND CULTURE!
On Friday, January 31, 2020, Councilmember Anita Bonds who chairs the DC Council Housing Committee, hosted a hearing on the DC Department of Housing Authority (DCHA) and their “respositioning” plan for DC’s public housing stock — real homes where real people live and have real personal and professional networks.
Some public housing residents were in attendance and testified to the deplorable conditions that Chairwoman Bonds has heard about with public housing continually for years — mold, pipes leaking, rodents, infrastructure, etc.
There were ANC Commissioners and Ward 6 Public Housing residents there, like Commissioner Rhonda Hamilton who says she knows of pets living in better conditions than that provided at housing managed by DCHA.
There were other residents testifying from Greenleaf Public Housing in the Southwest, DC, Ward 6, testifying about the terrible living conditions that must be repaired now, not over a 17-year DCHA plan.
Mrs. Shont’a High, President of the Park Morton Residents Council in Ward 1 describes how DCHA has begun the plan to “revitalize” her community. She speaks about being thrown out of her home of nearly twenty years by DCHA’s repositioning plan.
Denise Thomas lives/ed in Ward 7’s Kenilworth Gardens, which has seen DCHA begin its “repositioning” on her home and neighborhood and how its destroying all of it.
Chris Otten, a DCHA client in Ward 1, describes what it is like living in a DCHA-subsidized unit that is managed by a private slumlord with toxic dust and mildew never being remedied.
Paulette Matthews, bounced from Barry Farms Public Housing in Ward 8, now lives in Ward 1, who describes the horrendous disruption from displacement and how it has changed her life and that of her family.
Councilmember Elissa Silverman actually sums it up DCHA’s “repositioning” plan during her opening remarks:
I am extremely concerned that DCHA is not just drifting away from serving its most vulnerable residents but deliberately abandoning our most vulnerable residents.I fear that DCHA has grown into an appendage of the real-estate division of our Deputy Mayor for Planning and Economic Development (DMPED). And, this is going to lead to the continued gentrification of our city.
For the full Council video, all 13GB’s of it, click this link.
In a recent post to a popular DC listserve, there was this comment:
A new ADU (and ADUs at scale) will “contribute to affordability” in terms of adding supply, and thereby reducing the overall pressure for price appreciation and the concomitant pressure to convert existing lower priced housing to standards and expectations which satisfy higher priced segments of the market.
Richard Layman rlaymandc@yahoo.com, Saturday, February 1, 2020, Comment on Columbia Heights listserve columbia_heights@yahoogroups.com
The above intriguing comment seems to not consider the concept that #HousingIsNotACommodity and rather #HousingIsAHumanRight . . . right?
Moreover, the lack of a race and class analysis in pubic discussions around housing and jobs at this point is frustratingly maddening. Essentially, one can enjoy a “LIVABALE WALKABLE” city only if you are young, professional, single, and likely white.
Going to the facts spells that housing is a human need not a product and exposes this false sense that supply of any new housing relieves some kind of “pressure.”
This means the posture of continuing to construct more and more of the status quo unaffordable housing for single wealthy professionals without an equally important push for getting longtime DC residents and Black families real jobs with real pay to be able to stay here during the modern day goldrush is simply ignorant and discriminatory.
And, even if policy makers and the Mayor could wrangle some economic systems that actually helps longtime DC residents and families, there’s no way they will be implemented in a timely way to keep up or be substantial enough to help most people becoming more and more vulnerable to displacement.
Bottom-line, given the absolute real estate fire of the last decade and construction of tens of thousands of unaffordable single professional housing, there is absolutely no excuse that anyone should be pushing the idea that constructing any housing type at any cost is ok without a race and class analysis, especially considering the ballyhoo’d equitable development as expressed in Comp Plan Framework changes.
WE MUST ACCOUNT FOR THE CURRENTLY VACANT UNITS IN THE CITY
So what of the 30,000 vacant units according to the census, where the vacancy information gathered by the American Housing Survey (AHS) conducted biennially by the U.S. Census (more info about the survey below) shows this:
This table (B25004) represents the 5-year estimate from the AHS for Washington, D.C. This timeframe reflects 60 months of collected data and is the most reliable metric for estimating how many housing units fall into each of these categories. There are also 1-year and 3-year estimates, explained here. The Metropolitan Statistical Area (MSA) is the smallest level at which the survey reports data.
Empty units do not create successful inclusive DC communities.
The biggest purveyors of the supply & demand myth are the so-called urbanists — largely white single professionals moving back into the cities after their grandparents and parents failed suburban experience, or their cohorts from the mega-real estate industry.
IF WE WANT A SUCCESSFUL INCLUSIVE CITY — THAT MEANS WE GOTTA HAVE POLICIES AND PEOPLE THAT ESPOUSE SUCH IDEALS, NOT JUST STATE THE RHETORIC. WE ALSO HAVE TO HAVE REAL FACTS AND PEOPLE-CENTERED ANALYSIS BEFORE US, NOT JUST REAL ESTATE DOGMA.