Category Archives: Planning & Zoning

What Do YIMBYs and Donald Trump Have in Common?

trump_yimby.jpg


What Do YIMBYs and Donald Trump Have in Common?

  1. YIMBYs and Trump are consistently complicit in the offloading of vast amounts of public property to friends in the speculative real estate market, prioritizing luxury housing for affluent singles while ignoring the affordability needs of working families. https://savedcpublicland.org/the1617project/2023/06/09/dcs-sordid-track-record-of-public-land-giveaways/ 
  2. Both Trump and YIMBYs ignore or dismiss genuine solutions that could provide DC and cities across the nation the truly affordable housing it deserves. Instead of deploying programs such as custom zoning and social housing, Trump and YIMBYs favor private developers doing the lifting and grifting instead of public initiatives, effectively spitting in the face of HUD and endorsing the privatization of public housing through “repositioning” programs. https://ggwash.org/view/97236/dcs-public-housing-agency-is-making-halting-progress-but-much-more-needs-to-be-done 
  3. Both YIMBYs and Donald Trump share a deeply troubling agenda that displaces people of color from their rooted neighborhoods without much concern or acknowledgement. This is seen vividly in Washington, D.C., where our city consistently ranks among the top cities for gentrification, with devastating impacts on longstanding Black communities with barely a blush by YIMBYs. https://journals.sagepub.com/eprint/EVDFHVYYVVSXWIYMPVQ9/full

YIMBYs don’t have to care about the impacts of their build-baby-build rhetoric because they are privileged enough not to bear the adverse brunt of their advocating to privatize public land and build more luxury units, this same policy that benefits the exact class of real estate players who fund campaigns of politicians like Donald Trump. 


But wait there’s more . . .

Find out why the YIMBY “affordability” program in DC, called “Inclusionary Zoning” or “IZ”, is an absolute fraud perpetuated to guise the overblown and continuing construction of mostly unaffordable market-rate luxury housing units despite the growing racial disparity and displacement in DC.


Other links of import::


What's DC's Chinatown without Chinese People? www.SaveChinatownDC.org

What’s Chinatown without Chinese people? www.SaveChinatownDC.org

Save Chinatown Solidarity Network DC has put up a website and it’s startling.

There’s only about 300 Chinese folks left in DC’s Chinatown which begs the question: What’s Chinatown without Chinese people?


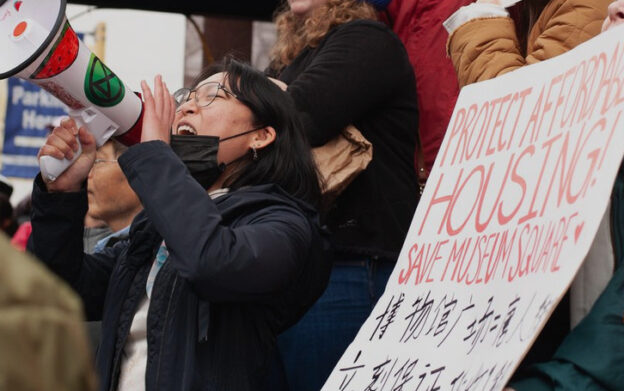
There’s a petition about Saving Museum Square where some of the remaining Chinese and other lower-income Downtown residents and families live. Apparently, the slumlord is slowly pushing residents out of the building by neglect and harassment in order to sell and demolish their home for … guess what … more luxury housing. Petition here: https://actionnetwork.org/petitions/save-museum-square
 
There’s also the threat of wiping out some of the remaining Chinese businesses (now and into the future) by the proposed 10-story luxury hotel along the 500 block of H Street. More here: https://www.savechinatowndc.org/hstreethotel


Let’s take a look at a sample of the DC Comprehensive Plan and what it says about Chinatown


From the Central Washington Area Element of the Comp Plan, Chapter 16

https://planning.dc.gov/node/574842

Today, Chinatown is facing challenges retaining its identity as the area around it booms with new retail, office, entertainment, and housing development. The Chinese population in the area has been declining for decades, and many of the Chinese businesses are having a difficult time keeping pace with rising rents and land costs. OP’s 2009 Chinatown Cultural Development Small Area Action Plan found that in 1970, there were 3,000 Chinese Americans living in and around Chinatown. That number had declined to fewer than 300 by 2009. 10A DCMR 1613.2.

Policy CW-2.3.1: Sustaining Chinatown
Retain and enhance Chinatown as a thriving downtown community, including housing, community, and cultural facilities; ethnically oriented, street-level retail; related wholesale operations; office and professional uses; and hotels. 10A DCMR 1613.4

Policy CW-2.3.2: Preserving Chinatown as a Viable Community
Preserve and conserve Chinatown, not only by installing Chinese-inspired building facades and street signs, but also by supporting the cultural traditions of the local Chinese community, assisting Chinese-owned businesses within Chinatown, sustaining the social services that serve the Chinese population, and attracting new activities that expand the area’s role as a regional center for Chinese culture and education. 10A DCMR 1613.5

Action CW-2.3.A: Chinatown Design Review
Continue to implement design review procedures that support the authentic expression of Chinese culture in new and rehabilitated development, including, as appropriate, building design, signage, streetscape, and open space criteria. Periodically review the procedures and update them as necessary. 10A DCMR 1613.9

From Chapter 7 of the Comp Plan — Economic Development
https://planning.dc.gov/sites/default/files/dc/sites/op/publication/attachments/07_ED.pdf

Small and Minority Businesses
Minority business enterprises represent an important subset of small businesses in Washington, DC. Their growth and expansion remain a particularly high economic development priority, and efforts should continue to streamline processes and provide innovative assistance. 10A DCMR 714.13(a)

Action ED-1.1.B: Data Tracking

Maintain and regularly update statistical data on employment in core sectors, wages and salaries, forecasts by sector, and opportunities for future employment growth. Where possible, the District should consistently track, collect, and disaggregate data by race. 10A DCMR 703.22

Action ED-3.2.D: Small Business Needs Assessment
Conduct an assessment of small and minority business needs and existing small business programs in the District. The study should include recommendations to improve existing small business programs and to develop new programs as needed. 10A DCMR 714.20

Policy ED-3.2.1: Small Business Retention and Growth
Encourage the retention, development, and growth of small and minority businesses through a range of District-sponsored promotion programs, such as Made in DC and 202 Creates, as well as through technical and financial assistance programs. 10A DCMR 714.6

Policy ED-3.2.6: Commercial Displacement
Avoid displacement of small, minority, and local businesses due to rising real estate costs. Develop programs to offset the impacts of rising operating expenses on small businesses in areas of rapidly rising rents and prices. Also consider enhanced technical support that helps long-standing businesses grow their revenues and thrive in the strengthening retail economy. 10A DCMR 714.11

Policy ED-3.2.7: Assistance to Displaced Businesses
While avoiding displacement where possible, assist small, minority, and local businesses that are displaced as a result of rising land costs and rents, government action, or new development. Efforts should be made to find locations for such businesses within redeveloping areas, or on other suitable sites within the District. 10A DCMR 714.12

Action ED-3.2.A: Anti-Displacement Strategies
Complete an analysis of alternative regulatory and financial measures to mitigate the impacts of demographic and economic market changes on small, minority, and local businesses. Measures to be assessed should include, but not be limited to, technical assistance, building purchase assistance, income and property tax incentives, historic tax credits, direct financial assistance, commercial land trusts, relocation assistance programs, and zoning strategies, such as maximum floor area allowances for particular
commercial activities. 10A DCMR 714.17

Policy ED-3.2.11: Small Business Capacity Building

Promote capacity building for small businesses, including equity impact enterprises, that expand awareness of financial management, strategic planning, inventory management, legal requirements and risk management, and proven marketing techniques. Expanding awareness of these techniques will help small, minority, and local businesses grow along with the District’s economy. 10A DCMR 714.16


DC’s Affordability Policy Based on the “AMI” is Broken

During the pandemic in 2022, GGW’s Libby Solomon covered how DC’s “affordability” index is based on the DMV’s ever increasing Area Median Income (“AMI”). See here: https://ggwash.org/view/81935/here-are-dcs-new-affordable-housing-income-limits-for-2021

However, what GGW consistently forgets to do is make some solid conclusions that may help the people struggling to stay in their hometown of DC. For example, using Ms. Solomon’s insights and links in her post above combined with the data points below (all cited and sourced to original DC government reports), we conclude:

DC’S AFFORDABILITY POLICY IS BROKEN

  1. Any “affordability” policy in DC that relies on the annually increasing Area Median Income (“AMI”) or functional equivalent Median Family Income (“MFI”) is broken;
  2. The policy and results become more and more broken as wealthy residents in the region become wealthier and as the DMV welcomes more and more new wealthy people.
  3. As the AMI continues to trend upwards, DC becomes less affordable and gentrification increases. This means the growing displacement of lower income residents which pushes up the AMI even faster fueling even more gentrification.

Looking at the AMI Numbers — DC’s affordability is becoming less and less affordable as the AMI increases annually

See the following data points over time:

Year; AMI
2011; 106,100
2013; 107,300
2015; 108,600
2018; 117,200
2020; 126,000
2021; 129,000
2022; 142,300
2023; 152,100

Conclusion:

Between 2013 to 2023, the AMI has increased $44,800, a 42.2% increase over ten years. This means the available pool of “affordable” units becomes less and less accessible by those who need it most as wealthier DC residents (those making more than two to three times the minimum wage) can qualify for DC’s limited supply of so-called “affordable” housing units.

The U.S. Census numbers show the results: A substantial number of lower income families and residents have been displaced from the city (60,000 Black residents over the past two decades) under DC’s current broken “affordability” policy based on the ever increasing “AMI.”

Ward One leads in Black displacement, with 25% of the Black population made gone over the past ten years as the AMI is really just starting to soar.

AMI Sources:

Colby King

Colby King on Black Displacement from Washington D.C.

“The most destructive force to strike my native District of Columbia in my lifetime has been displacement: the forced removal of Black families and their community-binding activities and institutions from areas such as the Foggy Bottom and West End neighborhoods of Northwest D.C. and the southwest side of town. Displacement of thousands from places they had lived for generations to make room for new housing, better buildings and ultimately more affluent and privileged people.”  

Opinion, “D.C. shoved Black neighborhoods aside. It’s still paying the price” by Colbert I. King, published in the Washington Post on January 19, 2024, https://archive.ph/5gxwK

The city's “poor folk [are being forced] out of their neighborhoods” by the city's “active role in development, selling or leasing publicly owned land, changing zoning laws, closing alleys and providing developers with inducements to construct new — or refurbish old — buildings … with resultant racial and class tensions.”

Opinion, “Quit the posturing in the Banneker-Shaw school dispute” by Colbert I. King on May 24, 2019 in the Washington Post, https://archive.ph/OSHig

“The city's growing tax base of middle-class couples and singles makes D.C. Mayor Anthony Williams giddy. The sight of “undesirable” neighborhoods being rapidly transformed into places where wealthier folks want to live makes Williams go weak in the knees. These changes are just what the mayor, his economic planners and his business friends ordered. Besides, there's no time for the displaced. The mayor's too busy with the National League of Cities and, when he's home, being wined and dined in glitzy downtown restaurants, Georgetown salons and the homes of folks he never thought he would meet when he was laboring as an Agriculture Department bureaucrat. The whole thing has turned his head. So what if booming property values and a richer downtown cultural life aren't doing much for renters or the evicted?”  

Opinion, “Turning a Deaf Ear to the Displaced” by Colby King dated January 8, 2005, published by the Washington Post,  https://archive.ph/ps8ft#selection-949.33-949.846


Sources:

Census 2020 :: Black Displacement from DC by Ward

DC Census Shocker: Ward 1 Shows Profuse Black Displacement While Ward 3 Has Grown in Black Population; Rest of City (except Wards 7, 8) Loses Significant Numbers of Black Residents & Families

When the 2020 US Census numbers were published in 2021, local press guise the massive displacement of Black folks from D.C. as “integration” or “growing diversity” (over past 2 decades, 60k Black folks have been made gone from the city).

Also notably missing in any local census analysis is the fact that the ward scapegoated for being exclusive and segregated was one of two wards that increased in Black residents over the past 10 years.


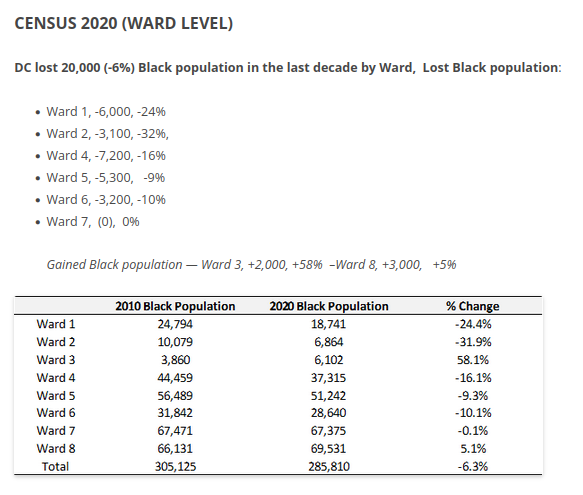
CENSUS 2020 (WARD LEVEL)

DC lost 20,000 (-6%) Black population in the last decade by Ward,  Lost Black population:

  • Ward 1, -6,000, -24%
  • Ward 2, -3,100, -32%,
  • Ward 4, -7,200, -16% 
  • Ward 5, -5,300,   -9%
  • Ward 6, -3,200, -10%
  • Ward 7,  (0),  0%

    Gained Black population — Ward 3, +2,000, +58%  –Ward 8, +3,000,   +5%

In response to all the amazing comments to this post

Here are some of the key sources we can relay that support the Census chart demonstrated above and showing that Ward 3 increased in Black residents while the rest of the city (except Wards 7 and 8) saw the startling displacement of longtime residents who identify as “Black-alone” on the 2020 US Census.


First, going to OP’s index of all the sources regarding the 2020 census >> https://planning.dc.gov/publication/2020-census-information-and-data

From the OP index and one table in, find this chart.

Using the charts from OP, review the 2020 DC Census by Ward analysis provided by Blaine Stum, The Legislative Policy Advisor for the Office of Chairman Phil Mendelson :: https://mobile.twitter.com/Blaine_Stum/status/1425885669113712651

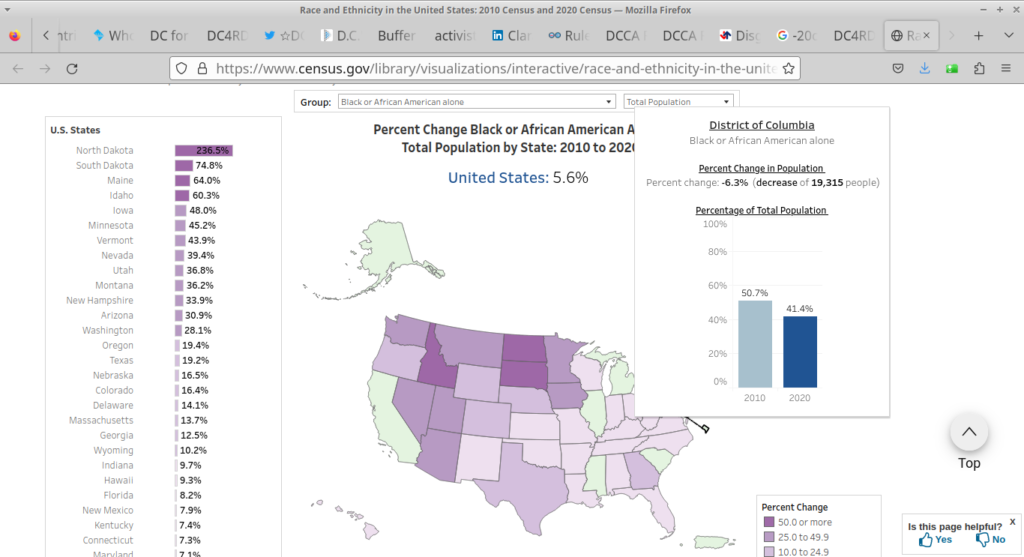
Then below, find snapshots of the US Census website demonstrating the startling numbers of DC Black displacement which you can access here >> https://www.census.gov/library/visualizations/interactive/race-and-ethnicity-in-the-united-state-2010-and-2020-census.html

​​


Also to note among the Census data points is the racial wealth income gap, a stark reality for those living and working in D. See the Washington Post Analysis, Economy, “The black-white economic divide is as wide as it was in 1968, Economy” By Heather Long and Andrew Van Dam, dated June 4, 2020, “… [T]he gap between the finances of blacks and whites is still as wide in 2020 as it was in 1968, when a run of landmark civil rights legislation culminated in the Fair Housing Act in response to centuries of unequal treatment of African Americans in nearly every part of society and business.” https://archive.ph/thnvI#selection-1621.0-1621.303


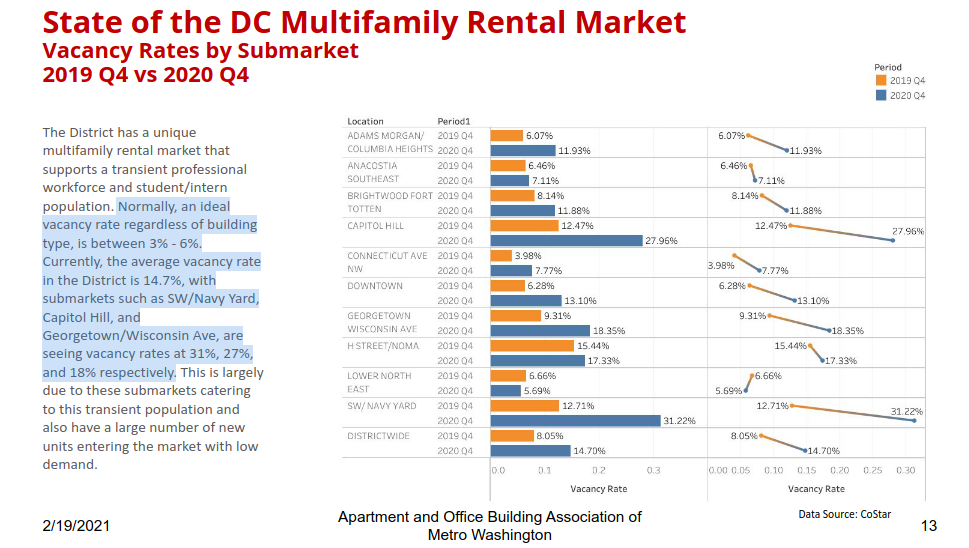
Moreover, there are 40,000+ vacant housing units conservatively citywide and likely more now!

(AOBA report 2019-2021 at p.13). Imagine now, how and why the blue-ist city in the nation can define “Housing Affordability” as a housing unit affordable for an individual making 120K/yr.


It is a preeminent policy failure that harms Black DC and increases displacement pressures each time you hear a developer, the Mayor, anyone say they are constructing “affordable housing.” See more here >> https://twitter.com/dc4reality/status/1624111925494706177

Housing is a Human Right

YIMBY’s: D.C. “Desperately & Urgently” Needs More Housing

We hear so-called YIMBYs constantly cheer on listserves and real estate blogs, #BuildMore housing quickly and voluminously. They say the city is desperate for new housing and we need lots of new units urgently. Any skeptics or detractors to this build-baby-build posture are quickly written off simply as NIMBYs.

Yet, the YIMBYs can never seem to answer these basic questions:

  1. New housing for whom? Is it the trickle down market rate housing being built everywhere or truly affordable for those making the living wage or less?
  2. What statistics substantiate the “urgency” for new housing? DC has some of the highest vacancy rates in the nation, will building more of the same help?
  3. And, why is the city tearing down the 0-30%AMI housing such as public housing to privatize and build more luxury housing?

Last we checked, the well heeled developer-class have collaborated with cohorts in city bureaucratic planning positions to usher in wave after wave of new construction, with areas of DC exploding with denser taller buildings consisting of expensive studio/one bedrooms.

Tens of thousands of new luxury units have been built in DC over the past twenty years and 9 out of 10 of these units are strictly targeted to wealthier single professionals.

But recently, it is this slice of the local demography (single wealthy professionals) who are parting with the urban core as they are forming families and being quite privileged and mobile they can move when things like pandemics unfold and impact our living collective conditions. Yes, it is these new residents who stormed into the city over the past decade who are now choosing to leave the big box luxury buildings that were designed for them and are moving into single family homes in outer city limits and back to suburbia. 

Thus, any urgency for more housing serving the professional-class  is quickly dispelled by the facts on the ground, with DC conservatively having 15% of units built (not just marketed) sitting vacant, and the new built-out areas such as Navy Yard having 1 in 3 units empty (all pre-pandemic numbers). 

[Pre-pandemic], the average vacancy rate in the District is 14.7%, with submarkets such as SW/Navy Yard, Capitol Hill, and Georgetown/Wisconsin Ave, are seeing vacancy rates at 31%, 27%, and 18% respectively .

DHCD Report, Saving DC’s Rental Housing Market Strike Force, citing from “The State of the DC Multifamily Rental Market” analysis by the Apartment & Office Building Association of Metropolitan Washington (AOBA), published by Randi Marshall, Vice President of Government Affairs, D.C., February 19, 2021, at page 13.

Housing as commodity, not for community

In spite of mounting units being built but left to sit empty, its become apparent that the mega real estate companies don’t mind and are pushing to build even more housing that’s as expensive as ever before.

This is because housing is no longer necessarily for creating human community. Rather, new housing units are in large part serving as international investment commodities, that are essentially blocks of money in the form of new housing construction.

Moreover, any claimed desperation or “urgency for more housing” is a statement of perverse absurdity without doing the homework in understanding the type of housing the city truly needs constructed (see 40k person waiting list for affordable family sized housing).

YIMBY’s see no urgency to build housing that we actually need, instead they continue to chant and demand the city construct housing that only serves an elite professional-class.

DC desperately needs 0-30%AMI units and lots of them, so say the PHIMBY’s (Public Housing in My BackYard).

See links below for stats and research substantiating the points above.


Stats and Facts Supporting the Above Conclusions

Racial Inequity: 1990 60% of DC Black vs 2010 50% 2020 41% [2020 census | interactive DC diversity app] 60k Black people displaced from DC over the past twenty years of #BuildMore, these stats cannot be ignored!

  1. DC racial segregation through affordability gap as wide as 1968: White wealth surge; black wealth stagnation 
  2. Mythbust: we are not in housing crisis, other than an “affordable” housing crisis (we lack units for those in the 0-50%AMI range)
    1. Vacancies citiwide is 14.7% (Navy Yard; Gtown/Wis Ave up to 31%)
    2. Slow down of incoming DC residents
    3. Offices hit record vacancy high in 2021

Foreign investors snap up Washington real estate at an accelerating clip

“This is the normal world. You go to work in a city. All around you are enormous new buildings. They look alike. But you will never be able to afford to live in them. Because they are not really homes. They are blocks of money,  bought by global investors whose money has nowhere else to go.” https://twitter.com/rotten4eva/status/1492740361374121986


THE DC COMP PLAN IS RACIST

Maurice Cook, Director of Serve Your City, and community advocate out of Ward 6 discusses the DC Comprehensive Plan, the definition of racial equity and affordable housing, and what the Council Office on Racial Equity (CORE) report about the #DCCompPlan means to Black people living and working in the District of Columbia. Please Watch :: https://youtu.be/zDH96HFqfP8

100 MOR McMillan Projects

The DC Comprehensive Plan (“Comp Plan” or “Plan”) is a key legislative document that covers a range of topics, from economic development, housing, the environment, parks and community services, transportation, and more.

There are maps within the Comp Plan, the most important being the Future Land Use Map (FLUM).

The Future Land Use Map (FLUM) determines how DC will develop and grow as we move into the future and allows all residents and city planners to anticipate and prepare for development, no surprises!

The DC Office of Planning under the direction of the DC Mayor is now suggesting changes to the Comprehensive Plan, 1500-redlined pages of proposed amendments to the existing Plan policies and maps. They have delivered these proposed changes to the DC City Council to consider passing into law.

The Mayor put up a website to show the public (to a degree) the massive tome of amendments to the Plan. By the way, if you don’t speak or read English, you have been left completely out of the conversation.

On the Mayor’s Comp Plan website, there is a nifty maps page that was recently uploaded that uses a slider to let you see the proposed areas of the city where the Office of Planning wants to change future development, going up with bigger and denser buildings.

Sliding over the whole city and you see an array of properties that the Mayor seeks to upzone, aka upFLUM. What you don’t see are the numbers in square feet of how much density the mayor wants to allow to be developable as a “matter of right” (MOR).

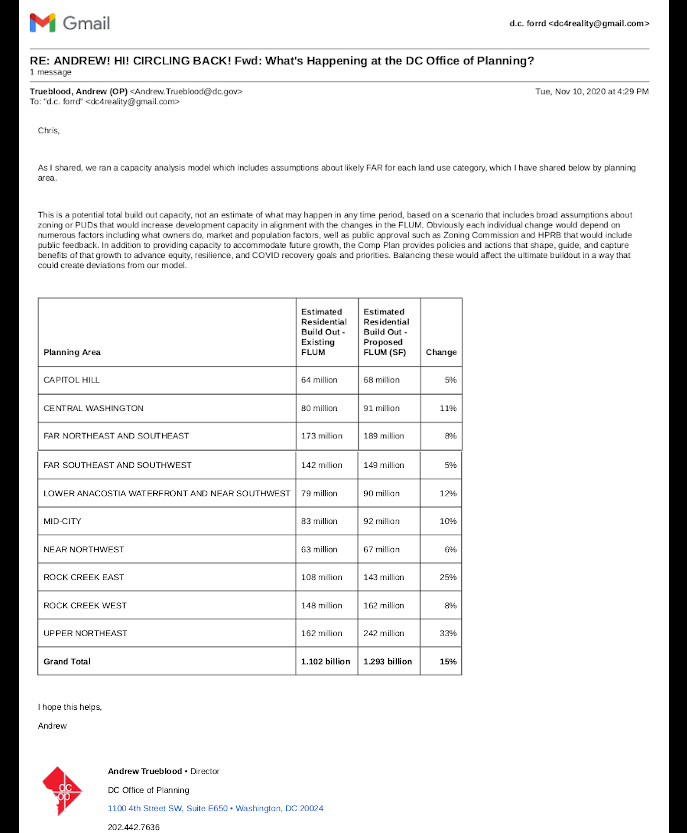
In fact, no where on the Mayor’s Comprehensive Plan website will you find any facts relaying to the public that the proposed FLUM map changes equate to upzoning close to 200 million square feet of land and air rights.

As a friend suggests, the map changes show city officials essentially printing money for the landowners of these lucky properties being upFLUMed.

How did we get the numbers? A Socratic conversation with the director of the Office of Planning, Director Andrew Trueblood, and his staff by email.

The result of this conversation was a matrix showing the reality of the proposed changes to the Comprehensive Plan FLUM map, or almost 200 million square feet of proposed upzoning around the city.

This 200 million square feet of new habitable space and construction represents about what would be 100 “matter of right” McMillan Park projects.

Do you think this substantial change to the city’s built environment came with any impact assessments as required by the law? If you answered No, you’d be correct.

Why should we expect the Mayor’s Office of Planning actually do any “planning”? In fact the DC Council Chairman thinks planning is a popularity contest!

Read how the Office of Planning’s proposed changes to the Comp Plan is going to exacerbate displacement of Black folks in DC, click here.

DC Streetcar Extension Debate :: “Nostalgic Gentrification”

Nostalgic Gentrification As A Development Tool Vs. A More Practical And Budget Friendly Use of Circulator Buses

Transit Opinion by: Iris McCrea, Ward 7 Resident and Fort Dupont Civic Association Member

. . .

The position of the Fort Dupont Civic Association is against the extension of the Streetcar beyond the Langston Golf Course at Oklahoma Avenue, NE to East Capitol Street and Benning Road NE. However, we do support transit-oriented development along Benning Road and through sub-neighborhoods from Oklahoma Avenue to Southern Avenue which is even beyond the proposed end of the streetcar route.

. . .

[T]he Fort Dupont Civic Association strongly recommends the use of the Circulator Buses starting at Oklahoma Avenue instead of streetcars.

See Full Statement Here.

Dog Whistle Planning

Assail the Street View

“Urbanists” are assailing a new project about gentrification that incorporates the views of the streets in communities undergoing displacement. Here’s the project.

In examining the criticism of this new gentrification-analysis (a project, not a study) by students at the University of California Merced, we see several key aspects of the “urbanist” take on development of major cities in the US:

  1. Pushing a dogmatic belief that building more market-rate studio and one bedrooms will trickle down housing costs and this “filtering” effect is the key way to get past a decade-long housing crisis.

  2. Fostering ambivalence in municipal planning that eschews substantial permanent impacts that more development has on existing neighbors and neighborhood services such as a need for increased schools, libraries, clinics, parks, transportation, utility infrastructure, etc.

  3. Believing that a #BuildMore housing policy (even if its largely expensive studios and one bedrooms) doesn’t need to take account of the resultant displacement of communities of color. That is, smart growth means having an absolute ambivalence to witnessing Black and Brown neighbors getting displaced and replaced by whiter new neighbors in almost all major US cities.

  4. Possessing a monolithic cultural approach to reshaping cities in that all people — newcomers and existing residents alike — are expected to squeeze into untested development paradigms. That is, the desire to live with more neighbors is paramount to all other planning considerations especially if these new neighbors are whiter and able to afford significantly higher housing costs in much smaller unit sizes, and can afford expensive food, coffee and beer, appreciate yoga, and have a small dog.

IN SERVICE TO THE REAL ESTATE INDUSTRY

The critique of the Street View gentrification project indeed has some merit as for it’s limited data scope and subjective definitions.

However, if you are going to slam a qualitative look at gentrification and ignore the quantitative studies and real results of the overarching #BuildMore planning policies that this student project is based on, then you are acting in service to displacement. See the studies below.

For example, how about the data sets used to support the $1Billion Washington, DC gentrification lawsuit on behalf of longtime Black DC residents and families. The fact that real world data like that demonstrated in this critical lawsuit isn’t being incorporated by “urbanists” in their policy analysis & advocacy is quite telling, perhaps even a dog whistle.

Choosing to cherry pick and attack the one limited Street View project and then not openly assail existing harmful public policy that is actually driving our neighbors out of our longterm homes only helps propel real estate speculation and the developers bottom-line. Is that what you really want to do?

KEY STUDIES SEEMINGLY IGNORED BY CITY PLANNERS & URBANISTS

This study shows a feast or famine situation with government investments in our communities, and “[H]ighlights how gentrification and cultural displacement have unfolded in American cities, while many low-income small towns and rural neighborhoods remain starved of investment.”

A Governing report says, “Neighborhoods gentrifying since 2000 recorded population increases and became whiter, with the share of non-Hispanic white residents increasing an average of 4.3 percentage points. Meanwhile, lower-income neighborhoods that failed to gentrify experienced slight population losses and saw the concentration of minorities increase. They have also experienced different economic fates: Average poverty rates climbed nearly 7 percent in already lower-income tracts that didn’t gentrify, while dropping slightly in gentrifying neighborhoods.”

Blavity & Buzzfeed: “A new study … shows an increasing rate of Black residents are being driven out of neighborhoods in the U.S. According to the data, Oakland, Washington D.C., Atlanta, New York City and Baltimore are among the cities that are especially impacted by gentrification.”

This 2000-2010 study says, “Washington, DC, residents don’t need census data to tell them what’s obvious in their neighborhoods: the city is changing dramatically. But numbers can give us context. They can show us how shifts in population are reshaping the city and can help us prepare for changes to come.”

The LegalAid society interprets recent a key displacement study, “Cultural displacement happens when there is “a rapid decline” in the number of minorities in an area as “white gentrifiers replace” minority residents. Both gentrification and cultural displacement have left a powerful imprint on DC over recent years.”

To the public investment issue, “So where do upwardly mobile creatives go as they begin to get priced out? They seek less expensive neighborhoods, where the cycle of displacement continues. “Now, people are looking at Anacostia like, ‘Oh, this is a place to come,’” Aristotle Theresa said. “And so, now the government starts injecting capital into the area, when they didn’t before.”

WaPo analysis, “Low-income residents are being pushed out of gentrifying neighborhoods at the highest rate in the country. The neighborhoods that have experienced the largest outflow of low-income residents, according to the study — places such as Logan Circle, Petworth and Columbia Heights — have an average walk score of 82.5 and an average transit score of 74.5.”

Non-profit Quarterly comments, “The displacement numbers seem low, but the authors used fairly narrow definitions of gentrification and displacement.”

WJLA: Local Small DC Business also getting crushed under gentrification. “When you invest in a place without investing in the people, what happens is you’re displacing people,” Jesse Van Tol, CEO of the National Community Reinvestment Coalition (NCRC).

Georgetown Voice: “Gentrification isn’t just about the proliferation of pricey salad shops and craft breweries. According to a 2019 study, gentrification in D.C. has pushed more low-income residents out of their homes than almost anywhere else in the country. Between 2003 and 2013, 20,000 black residents were displaced from D.C.”

How about this study (from 2015) that defines gentrification not on a street view but on “a [census] tract’s median household income and median home value.”

Despite saying Gentrification is “beneficial” GGW cites studies that say, “A neighborhood out-mobility rate increase of a few percent on average, across gentrifying neighborhoods in the whole country, can mask what’s happening at the hyper-local scale. In certain neighborhoods, out-movement through displacement, whether direct or indirect, has likely been much higher.”

“In the District of Columbia, low-income residents are being pushed out of neighborhoods at some of the highest rates in the country, according to the Institute on Metropolitan Opportunity, which sought to track demographic and economic changes in neighborhoods in the 50 largest U.S. cities from 2000 to 2016.” https://housingis.org/resource/gentrification-dc-means

Housing Vacancy Crisis in DC

The DC Housing Crisis vs 30,000 Vacancies in DC. . . What is Going On?

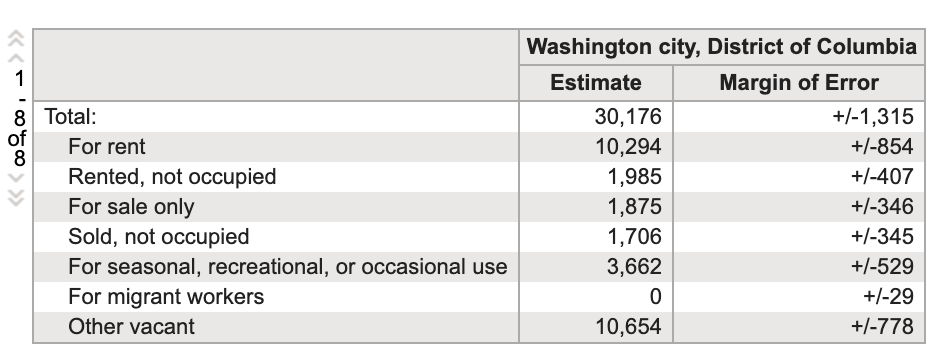
The vacancy information for Washington, D.C. below is based on the 2019 American Housing Survey (AHS) which is conducted biennially by the U.S. Census.

This AHS survey asks landlords about vacancy status, resulting in this table below (Table: B25004) representing a timeframe of 60 months of collected data. There are also 1-year and 3-year estimates.

The Metropolitan Statistical Area (MSA) is the smallest level at which the survey reports data.

https://www.census.gov/programs-surveys/acs The American Community Survey (ACS) of the US Census provides estimates of vacant units by type of vacancy and calculates estimates of rental and homeowner vacancy rates. Surveys 3 million addresses per year (mandatory survey).

How can there be 30,000 vacant units when we have a housing crisis?

Thirty thousand vacant units counted! This fact destroys any assumption that building more luxury housing will eventually result in lower cost housing units trickling down in what growth supporters call, “Filtering.”

The D.C. Chief Financial Officer has a bit more of a conservative number of vacant housing units, 10,000. Either way, that’s thousands of vacant units existing pre-Covid that could house our homeless veterans, mothers, families, children, people who are facing homelessness, etc., especially now during the pandemic. See Vacant to Virus Reduction site.

Luxury Units Stay Empty Without Any Market Corrections

Luxury units for investment (lots of it foreign) results in developer demand for upzoning to increase buildable density without providing housing to be lived in. What is the good of new housing being kept uninhabited by investors? It stifles free market supply-and-demand and keeps prices of housing high, while allowing bankers and the construction industry to profit.

Empty housing units are also tax liabilities that can be written off by mega real estate speculators at the end of the year, equaling a form of income. Thus, the myth of the effect of supply-and-demand on housing is exposed as the tax write-offs for empty units completely nullifies any market corrections.

Foreign Investment in Luxury Housing Creates Exclusive New Communities in DC With High Vacancies

U.S. real estate remains attractive for illicit money from all over the world. In DC, that foreign money invests into planning officials follies, like the dramatic changes at Union Market in Northeast. #UnionMarketExclusive

It’s a stable investment that generally maintains or grows in value – and it gives corrupt oligarchs and dictators a potential escape route if they’re ousted from their home countries.

But this money drives out honest purchasers and makes cities hotbeds for dirty, unproductive cash. It turns cities and communities into commodities.

In one part of New York City, for example, the Census Bureau estimated that 30 percent of apartments are unoccupied most of the year.

Legislation is needed to require habitation of units built. After all, owners are not permitted to keep houses vacant on the streets of DC. Why should it be different with condo or apartment buildings?

COVID UPDATE JUNE 2020

COVID UPDATE AUG 2020

The Washingtonian, August 3, 2020 — NoMa and H Street apartments are experiencing an 8.2 percent vacancy rate, while developments in Navy Yard and Southwest are seeing 7.7 percent vacancy. The vacancy rates in those areas were less than 5 percent at the same time last year. District-wide, the average vacancy rate in luxury apartments is currently 6.8 percent, compared to 4.1 percent last year.

COVID UPDATE: OCT 2020